Joseph's Site
My classwork for BIMM143
Class 12: RNASeq Galaxy Pt1/Population Analysis HW
Joseph Lo (PID: 18121493)
Section 1. Proportion og G/G in a population
Downloaded a CSV file from Ensemble https://useast.ensembl.org/Homo_sapiens/Variation/Sample?db=core;r=17:39894781-39895412;v=rs8067378;vdb=variation;vf=959672880#373531_tablePanel
Here we read this CSV file
mxl <- read.csv("373531-SampleGenotypes-Homo_sapiens_Variation_Sample_rs8067378.csv")

head(mxl)
  Sample..Male.Female.Unknown. Genotype..forward.strand. Population.s. Father
1                  NA19648 (F)                       A|A ALL, AMR, MXL      -
2                  NA19649 (M)                       G|G ALL, AMR, MXL      -
3                  NA19651 (F)                       A|A ALL, AMR, MXL      -
4                  NA19652 (M)                       G|G ALL, AMR, MXL      -
5                  NA19654 (F)                       G|G ALL, AMR, MXL      -
6                  NA19655 (M)                       A|G ALL, AMR, MXL      -
  Mother
1      -
2      -
3      -
4      -
5      -
6      -
table(mxl$Genotype..forward.strand.)
A|A A|G G|A G|G
 22  21  12   9
table(mxl$Genotype..forward.strand.)/nrow(mxl) *100
    A|A     A|G     G|A     G|G
34.3750 32.8125 18.7500 14.0625
Section 4 Population Analysis
How many samples do we have?
expr <- read.table("rs8067378_ENSG00000172057.6.txt")

head(expr)
   sample geno      exp
1 HG00367  A/G 28.96038
2 NA20768  A/G 20.24449
3 HG00361  A/A 31.32628
4 HG00135  A/A 34.11169
5 NA18870  G/G 18.25141
6 NA11993  A/A 32.89721
nrow(expr)
[1] 462
table(expr$geno)
A/A A/G G/G
108 233 121
median(expr$exp[expr$geno=="A/A"])
[1] 31.24847
median(expr$exp[expr$geno=="A/G"])
[1] 25.06486
median(expr$exp[expr$geno=="G/G"])
[1] 20.07363
Q13: Read this file into R and determine the sample size for each genotype and their corresponding median expression levels for each of these genotypes.
The sample size for A/A is 108 with a median expression level of 31.2, A/G is 233 with a median expression level of 25.1, and G/G is 121 with a median expression level of 20.1.
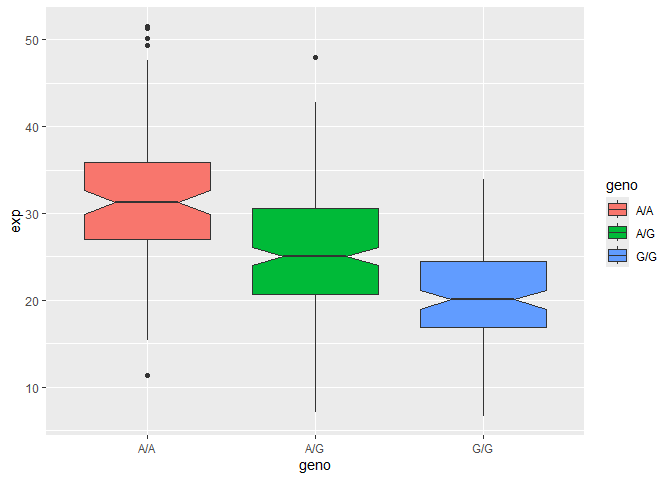
Q14: Generate a boxplot with a box per genotype, what could you infer from the relative expression value between A/A and G/G displayed in this plot? Does the SNP effect the expression of ORMDL3?
According to the boxplot, The relative expression value for G/G is much lower than A/A, which makes me think that having a G/G is associated with having a reduced expression of the gene. The SNP does effect the expression of ORMDL3 with G/G being associated with a reduced expression of the gene.
library(ggplot2)
Lets make a boxplot
ggplot(expr) + aes(geno, exp, fill=geno) +
  geom_boxplot(notch=TRUE)